GC forensics by example: multi-second pauses and allocation pressure
This post will analyze a Hotspot GC log exhibiting large GC pauses (> 1 min) leading to allocation pressure and system load as a cause of pathological behaviour on Hotspot’s garbage collector.
I will assume some familiarity with the JVM, GC, that you understand the basic lifecycle of an object, have notions of what a generational collector is and how the G1 collector structures the heap. If you want more info on these topics I recommend Oracle JDK documentation as a good starting point.
The log
The application ran with Oracle’s 1.8 JVM mostly on default settings (I
didn’t keep the exact parameters though). It did use the G1 collector
(-XX:+UseG1GC) and aproximately the following settings regarding GC
logs:
-Xloggc:$PATH
-XX:+PrintGCDetails
-XX:+PrintTenuringDistribution
-XX:+PrintPromotionFailure
-XX:+PrintGCApplicationStoppedTime
This would output logs at $PATH, with content similar to these:
...
2017-03-15T17:45:47.751+0100: 0.621: [GC pause (G1 Evacuation Pause) (young)
Desired survivor size 4194304 bytes, new threshold 15 (max 15)
, 0.0213976 secs]
   [Parallel Time: 9.5 ms, GC Workers: 18]
      [GC Worker Start (ms): Min: 621.3, Avg: 623.5, Max: 630.7, Diff: 9.4]
      [Ext Root Scanning (ms): Min: 0.0, Avg: 0.2, Max: 1.4, Diff: 1.4, Sum: 3.1]
...
Which is a detailed log of each GC event in the JVM. They’ll be useful to us later, but it’s not the best format to get a sense of how GC is behaving over time. A tool like GC Viewer comes handy in these situations.
This section correspond to one of the large pauses that we will be looking into:
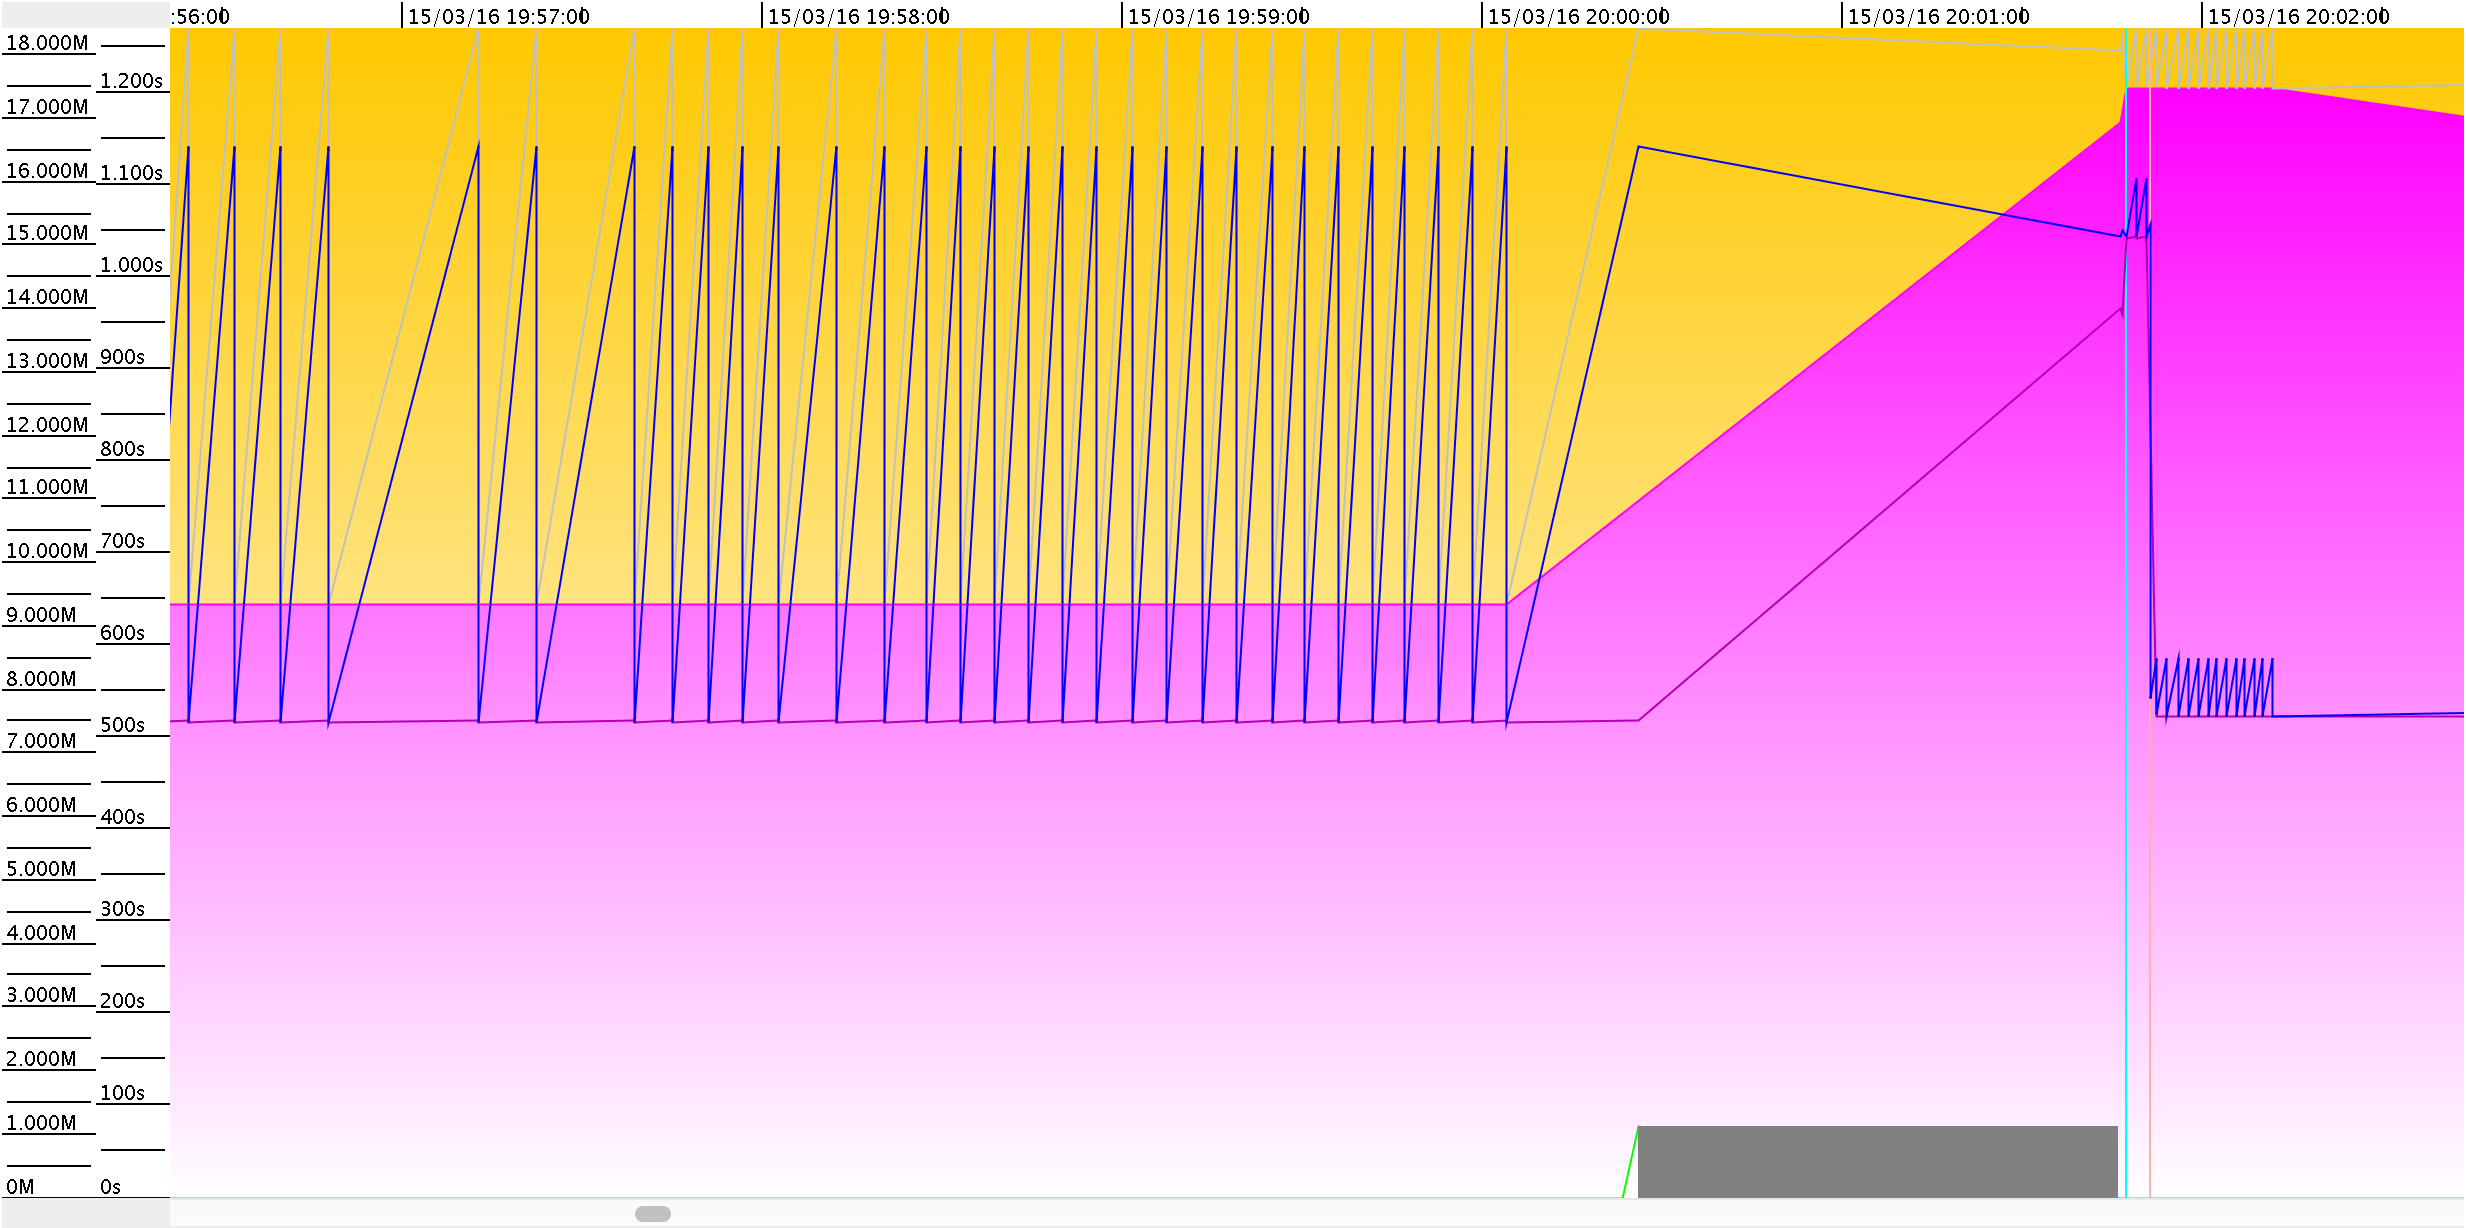
The horizontal axis shows time. Both memory size in MBs and pause time are shown in seconds on the vertical axis.
Two stacked areas represent the size of the Young and Old Generation (yellow and pink respectively). We had about 9.5GB Old Gen plus 8.5GB of Young Gen. These only show memory reserved by the JVM for the heap. Usage is represented with thin lines inside each area. In the Old Generation (pink area), a darker pink line shows Used Old Gen. In the Young Gen, usage is represented with a light grey line.
The see-saw pattern that we see for the first half of the graph represents a stable cycle. In each iteration, the application allocated new objects in the Young Gen until it eventually filled up (identifiable by the grey line hitting the top limit of the yellow area.). Then the JVM was forced to make room in the Young Gen by triggering a Minor Collection. Memory was released and utilisation in the Young Gen dropped back to the bottom of the yellow area. The application continued creating objects and the cycle repeated.
Minor collections recover memory in two ways. First, they release memory consumed by objects residing in the Young Gen when they are no longer referenced. This allowed the JVM to keep up with the application memory usage by collecting all 8.5GB on each iteration.
But this changes right after 20:00:00, with growth in both the Old Gen (pink area) and its utilisation (pink line) grow. This growth is explained because the JVM promotes objects from the Young Gen based on a maximum age: the tenuring threshold. This age is defined as the number of minor collections that an object survived in the Young Gen). After an object exceeds that threshold, the collector will promote it to the Old Gen.
According to our logs, the JVM was promoting so many objects that the Old Gen filled up, so it was necessary to expand it. (I will keep speaking about Young/Old Gen as individual contiguous space, in G1 this is valid from a logical point of view, but the actual heap layout is different.)
The graph shows how our GC event resulted in over half of the Young Gen being moved to Old Gen. Because the JVM had a fixed heap of 18GB (-Xmx18g) it wasn’t able to simply expand the heap. Instead, it shrunk the Young Gen to reassign the space to the old Gen. This brought two interesting effects.
- First, the smaller Young Gen now filled up much faster as the service kept allocating new objects at the same rate. Right below the 20:02:00 mark we see a tighter see-saw pattern that indicates more frequent Young Collections (of course, each iteration releases just a bit of memory.)
- Second, after two cycles in the tigher see-saw pattern, utilisation in the Old Gen (pink line) suddenly drops to the same level as it was prior to the resize. The JVM had just moved ~6GB to Old Gen, only to garbage-collect it shortly after. (╯°□°)╯︵ ┻━┻
This behaviour is common under high allocation pressure. The application creates too many short-lived objects that fill the Young Gen fast. This forces the JVM to trigger more frequent Minor Collections, which in turn causes live objects to age faster. That makes them hit the tenuring threshold earlier, causing premature promotions to the Old Gen as they will soon be unused and eligible for collection.
Why is this bad?
Take a look at the grey rectangle at the bottom-right of the graph, precisely in the interval where the JVM is growing the Old Gen. This is how GcViewer represents a GC Pause. Looking at the timestamps, this is well over a minute.
Why the pause? Well, none of this memory shuffling is cheap. To make things worse, these minor collections are also stop-the-world (STW) events: this means that the application was completely stopped. Let’s look at the GC logs to understand the details. Below is the relevant log for the event.
  1 	2017-03-15T20:00:26.471+0100: 8079.342: [GC pause (G1 Evacuation Pause) (young)
  2 	Desired survivor size 593494016 bytes, new threshold 15 (max 15)
  3 	- age   1:      60136 bytes,      60136 total
  4 	- age   2:       4312 bytes,      64448 total
  5 	- age   3:       3864 bytes,      68312 total
  6 	- age   4:       3784 bytes,      72096 total
  7 	- age   5:       3784 bytes,      75880 total
  8 	- age   6:       7568 bytes,      83448 total
  9 	- age   7:       3784 bytes,      87232 total
  10	- age   8:       3784 bytes,      91016 total
  11	- age   9:       3784 bytes,      94800 total
  12	- age  10:       7568 bytes,     102368 total
  13	- age  11:       3784 bytes,     106152 total
  14	- age  12:       3784 bytes,     109936 total
  15	- age  13:       3784 bytes,     113720 total
  16	- age  14:       7568 bytes,     121288 total
  17	- age  15:       3784 bytes,     125072 total
  18	 (to-space exhausted), 80.1974703 secs]
  19	[Parallel Time: 77390.8 ms, GC Workers: 18]
  20	   [GC Worker Start (ms): Min: 8079342.1, Avg: 8079342.2, Max: 8079342.2, Diff: 0.1]
  21	   [Ext Root Scanning (ms): Min: 0.2, Avg: 0.3, Max: 0.4, Diff: 0.1, Sum: 5.2]
  22	   [Update RS (ms): Min: 155.4, Avg: 267.9, Max: 567.9, Diff: 412.4, Sum: 4821.3]
  23	      [Processed Buffers: Min: 2, Avg: 7.3, Max: 14, Diff: 12, Sum: 131]
  24	   [Scan RS (ms): Min: 0.1, Avg: 0.4, Max: 3.1, Diff: 3.0, Sum: 6.3]
  25	   [Code Root Scanning (ms): Min: 0.0, Avg: 0.0, Max: 0.1, Diff: 0.1, Sum: 0.1]
  26	   [Object Copy (ms): Min: 76814.9, Avg: 77116.1, Max: 77231.5, Diff: 416.5, Sum: 1388089.1]
  27	   [Termination (ms): Min: 0.0, Avg: 5.9, Max: 7.2, Diff: 7.2, Sum: 106.6]
  28	   [GC Worker Other (ms): Min: 0.0, Avg: 0.1, Max: 0.2, Diff: 0.2, Sum: 2.1]
  29	   [GC Worker Total (ms): Min: 77390.4, Avg: 77390.6, Max: 77390.8, Diff: 0.3, Sum: 1393030.8]
  30	   [GC Worker End (ms): Min: 8156732.7, Avg: 8156732.8, Max: 8156732.9, Diff: 0.2]
  31	[Code Root Fixup: 0.0 ms]
  32	[Code Root Migration: 0.3 ms]
  33	[Code Root Purge: 0.0 ms]
  34	[Clear CT: 1.6 ms]
  35	[Other: 2804.7 ms]
  36	   [Evacuation Failure: 2778.0 ms]
  37	   [Choose CSet: 0.0 ms]
  38	   [Ref Proc: 5.6 ms]
  39	   [Ref Enq: 0.0 ms]
  40	   [Redirty Cards: 10.0 ms]
  41	   [Free CSet: 1.5 ms]
  42	[Eden: 9044.0M(9044.0M)->0.0B(320.0M) Survivors: 4096.0K->1132.0M Heap: 16.2G(18.0G)->14.8G(18.0G)]
  43    [Times: user=77.62 sys=2.54, real=80.20 secs]
There is a lot of information there, but let’s focus on the key relevant points for the topic we’re investigating.
Lines 1-18 yield a summary of the event enclosed in brackets [GC Pause
... The first two lines explain that the event was triggered due to
G1 Evacuation pause (young), meaning that the Young Gen filled up and
needed to be cleaned up. Lines 3-17 give details about the distribution
of object ages in the Young Gen, which I’ll skip as it’s out of scope of
this post. Line 18 ((to-space exhausted)...) indicates that the
target space (Old Gen) is not big enough to hold all the objects that
need to be moved. The full event takes 80.2s.
Line 19 explains that this collection used 18 threads and took over 77s.
19 [Parallel Time: 77390.8 ms, GC Workers: 18]
Lines 20-30 cover how long it took to execute the different phases of the collection. Most times went to Object Copy:
26 [Object Copy (ms): Min: 76814.9, Avg: 77116.1, Max: 77231.5, Diff: 416.5, Sum: 1388089.1]
Min/Max/Avg are stats per thread. The Sum is the aggregate for all worker threads (hence, Sum = N threads * Avg). Each one of the 18 threads are spending 77s on average simply to copy objects around.
We have non-negligible times in other phases. Line 22 reveals that almost 5s aggregated were spent in the Update RS phase.
22 [Update RS (ms): Min: 155.4, Avg: 267.9, Max: 567.9, Diff: 412.4, Sum: 4821.3]
RS stands for Remembered
Set,
an internal data structure kept by the JVM for each region. Given a
region X, its RS would track references from other regions that point to
objects that reside in X. Whenever the application updates the
references (e.g. when we assign a reference field in an object), the JVM
takes care of updating the RS.
For efficiency reasons those updates are buffered and processed
concurrently with the application. However, when the JVM starts a
collection it holds pending updates in this buffer while GC workers
perform an initial scan of the heap (Ext Root Scan at L21) looking for
live objects. Only when this scan is complete are RS updates in the
buffer drained. It looks like this step is taking significant time.
We’ll try to explain possible causes later.
Finally, we spot one more phase with significant times:
36 [Evacuation Failure: 2778.0 ms]
This line indicates that the JVM wasn’t able to move any more objects to either Survivor space or the Old Gen because the target space is already at max capacity. Evacuation failures can be expensive as handling them creates additional work for the JVM.
Moving on. Line 42:
42 [Eden: 9044.0M(9044.0M)->0.0B(320.0M) Survivors: 4096.0K->1132.0M Heap: 16.2G(18.0G)->14.8G(18.0G)]
Young Gen is both Eden (containing brand new objects) plus Survivor spaces (containing objects that survived >1 Minor collections, but < tenuring threshold). Eden was completely emptied (9044MB -> 0), and it was also shrunk from 9044MB to 320MB. Some of the objects evacuated from Eden stayed in Survivor spaces as they were not yet over the tenuring threshold, 1132MB in total.
The total heap size remains at 18GB (as determined by the JVM option
-Xmx18g), and usage went from 16.2GB -> 14.8GB. Overall, of the 9GB
evacuated from Young Gen. 2GB were released, 1GB remained in the
survivor space, and 6GB were moved over to Old Gen.
Using -XX:+G1PrintHeapRegions and -XX:+PrintAdaptiveSizePolicy would
have generated more details on this process, including a more verbose
description of the resizing decisions taken by the JVM.
-XX:+PrintAdaptiveSizePolicy
Unfortunately it was disabled at the time that the log was collected.
Finally, line 43 summarizes the times.
43 [Times: user=77.62 sys=2.54, real=80.20 secs]
User here is CPU time spent by the JVM. sys is time in OS calls
or waiting for system events. Real is clock time where the application
was stopped. So, to summarize:
- 18 threads moved ~6GB worth of objects.
- The full copy took about 77s for each thread.
Update RStook in aggregate 5s.- Evacuation Failures consumed over 2s.
- Real pause time was 80s, where 77.6s were in user space, 2.5s in OS.
Let’s look at the two main issues.
The problem with premature promotions
The most obvious observation is that we’re running into trouble as a result of allocation pressure. Frequent Minor GCs are needed to scan the live objects and move those that remain across survivor spaces. This frequency ages objects faster, the JVM ends up spilling objects to Old Gen (and in the particular case shown in the graph, triggering a region resize.)
Even though those objects are being promoted objects, their lifespan is not that large. Soon after being promoted to Old Gen most of them become garbage (no other objects reference them) and will need to be collected at some point by a Major collection (minor -> young gen, major -> old gen). These are the relevant logs from our example:
2017-03-15T20:01:47.849+0100: 8160.719: [GC concurrent-root-region-scan-start]
2017-03-15T20:01:47.849+0100: 8160.719: [GC concurrent-root-region-scan-end, 0.0001351 secs]
2017-03-15T20:01:47.849+0100: 8160.719: [GC concurrent-mark-start]
2017-03-15T20:01:51.521+0100: 8164.392: [GC concurrent-mark-end, 3.6726632 secs]
2017-03-15T20:01:51.522+0100: 8164.392: [GC remark 8164.393: [GC ref-proc, 0.0003795 secs], 0.1287467 secs]
 [Times: user=0.17 sys=0.01, real=0.12 secs]
2017-03-15T20:01:51.714+0100: 8164.585: Total time for which application threads were stopped: 0.0634409 seconds
2017-03-15T20:01:51.714+0100: 8164.585: [GC concurrent-cleanup-start]
2017-03-15T20:01:51.797+0100: 8164.667: [GC concurrent-cleanup-end, 0.0826101 secs]
Which correspond to a light blue line in the graphs. This is relatively cheap under G1 because the JVM is able to do most of the work concurrently with the application. Nevertheless, our app still still suffered a 60ms freeze, which is really not good if it’s minimally sensitive.
That Major collection needs an initial phase, which can be spotted with the “initial-mark” tag in a Minor collection (the Old Gen collector piggy backs on it.) I’m cutting the details, but note the additional time:
2017-03-15T20:01:46.983+0100: 8159.853: [GC pause (G1 Evacuation Pause) (young) (initial-mark)
Desired survivor size 75497472 bytes, new threshold 1 (max 15)
[...]
 [Times: user=10.49 sys=0.13, real=0.86 secs]
That’s another 0.86s freeze.
This is in fact a relatively good case. If the pattern of prematurely pushing objects to Old Gen continues, it may fill Old Gen and force the JVM to trigger a Full GC, which is even more expensive.
Preventing premature promotions
In cases such as this one, we would want tune our workloads for two properties:
- Minimize Minor collections: so that we avoid scans over the live set in the Young Gen, and copying between survivor spaces.
- Make each Minor collection count: by tuning your app’s workload so that each collection releases sufficient space in the Young gen to avoid promoting any objects.
The solution is usually a combination of both.
Having larger a Young Gen helps accomodate more objects (therefore less
Minor GCs) and clean up more on each one. Some handy options for this
are -XX:NewRatio, XX:G1MaxNewSizePercent, -XX:G1NewSizePercent
which are well
documented.
However fine tuning region sizes is a fragile equilibrium and hard to
achieve in non trivial applications. In practise, it’s better to just
use -XX:MaxGCPauseMillis=<number> so the JVM can try to size regions
(and tune other parameters) in the best possible way to meet those
targets. They are, however, not guarantees but best-effort. Note that
fixing Young Gen sizes overrides the target pause
goal
Another useful flag in this context -XX:G1ReservePercent which reserves a percentage of heap to be available the Survivor space during evacuation (default is 10%.)
In my experience having a relatively precise idea of your app’s allocation rate is important and effective. The memory allocated per unit of work (e.g. a request handled) also tells you the garbage that the JVM will have to clean after it’s completed. This information, plus heap sizes, helps doing reasonable capacity planning on your servers. For example, at 1MB/request and 100 requests/s, a Young gen with 100MB will fill up roughly once per second.
That was the route we followed at the time, along with taking advantage of several opportunities to reduce the amount of garbage generated per request (that’s a topic for another post.)
Poor GC throughput
Although our application’s workload is certainly causing too much work on the garbage collector, looking at the actual times they look excessive.
Having 18 threads move ~6GB in 77s per thread implies that each thread’s throughput was a tiny 4.3MB/s. Just for the sake of comparison, the same application running in similar hardware reported 407 MB/s. Regardless of the theoretical memory and JVM throughput, a 100x difference indicates that something is impacting the performance of GC worker threads on that specific environment. It’s not about only about the amount of garbage we’re generating.
LinkedIn has a couple of posts touching on some common causes, also mentioned in the Oracle documentation.
- The JVM is fighting for CPU time with other processes in the system.
- The JVM is having to allocate memory pages.
- The JVM is returning memory pages to the OS, which swaps them out to disk making later accesses more expensive.
- GC workers may be recruited by the OS for disk flushes, hitting them with syscalls and waits in the IO stack.
We could discard the second because the JVM pre-allocated the full heap
capacity up front. The swap hypothesis may be coming into play, but
having sys time at 2s, swapping doesn’t really explain the 77s in user
land.
The main hypothesis to confirm is whether the system is overloaded. Second, whether we’re having heavy I/O on the disk where logs are being written to.
We do find later in the logs some events that reinforce the overloaded option:
41034    [Eden: 804.0M(804.0M)->0.0B(804.0M) Survivors: 116.0M->116.0M Heap: 4585.4M(18.0G)->4620.3M(18.0G)]
41035  [Times: user=7.52 sys=0.25, real=131.86 secs]
As seen here, the sys time is negligible, and instead GC threads were
spending a lot of time idle waiting for CPU time. This service was
indeed sharing the machine with a couple other processes that were found
to be the culprits for this. Unfortunatley I did not keep sufficient
evidence from the time to share more details here.
Wrap up
The post has grown quite large so far so I’ll leave it here. To summarize, we’ve seen an example of a Hotspot GC log exhibiting big application pauses. A more detailed review of the logs showed that excessive allocation pressure was causing premature promotion, copying large sections of memory reserved for objects that would be eligible for collection soon after being tenured. We explored some measures that would help gain more insights into the process and options to improve the situation. Finally, we observed how GC times were also being impacted by neighbouring processes on the same host that caused significant CPU contention.
Any thoughts? send me an email!
To get notifications for new posts, subscribe to my mailing list, the RSS feed or follow me on Twitter / Mastodon.
Archive
- Alert on symptoms, not causes
- How about we forget the concept of test types?
- How organisations cripple engineering teams with good intentions
- Migrating an Eureka-based microservice fleet to Kubernetes
- Talk write-up: "How to build a PaaS for 1500 engineers"
- Kubernetes made my latency 10x higher
- Sizing Kubernetes pods for JVM apps without fearing the OOM Killer
- GC forensics by example: multi-second pauses and allocation pressure
- How does the default hashCode() work?
- Frugal memory management on the JVM (Meetup)
- DirectBuffer creation / disposal has hidden contention on sun.misc.Cleaner